Data Visualization
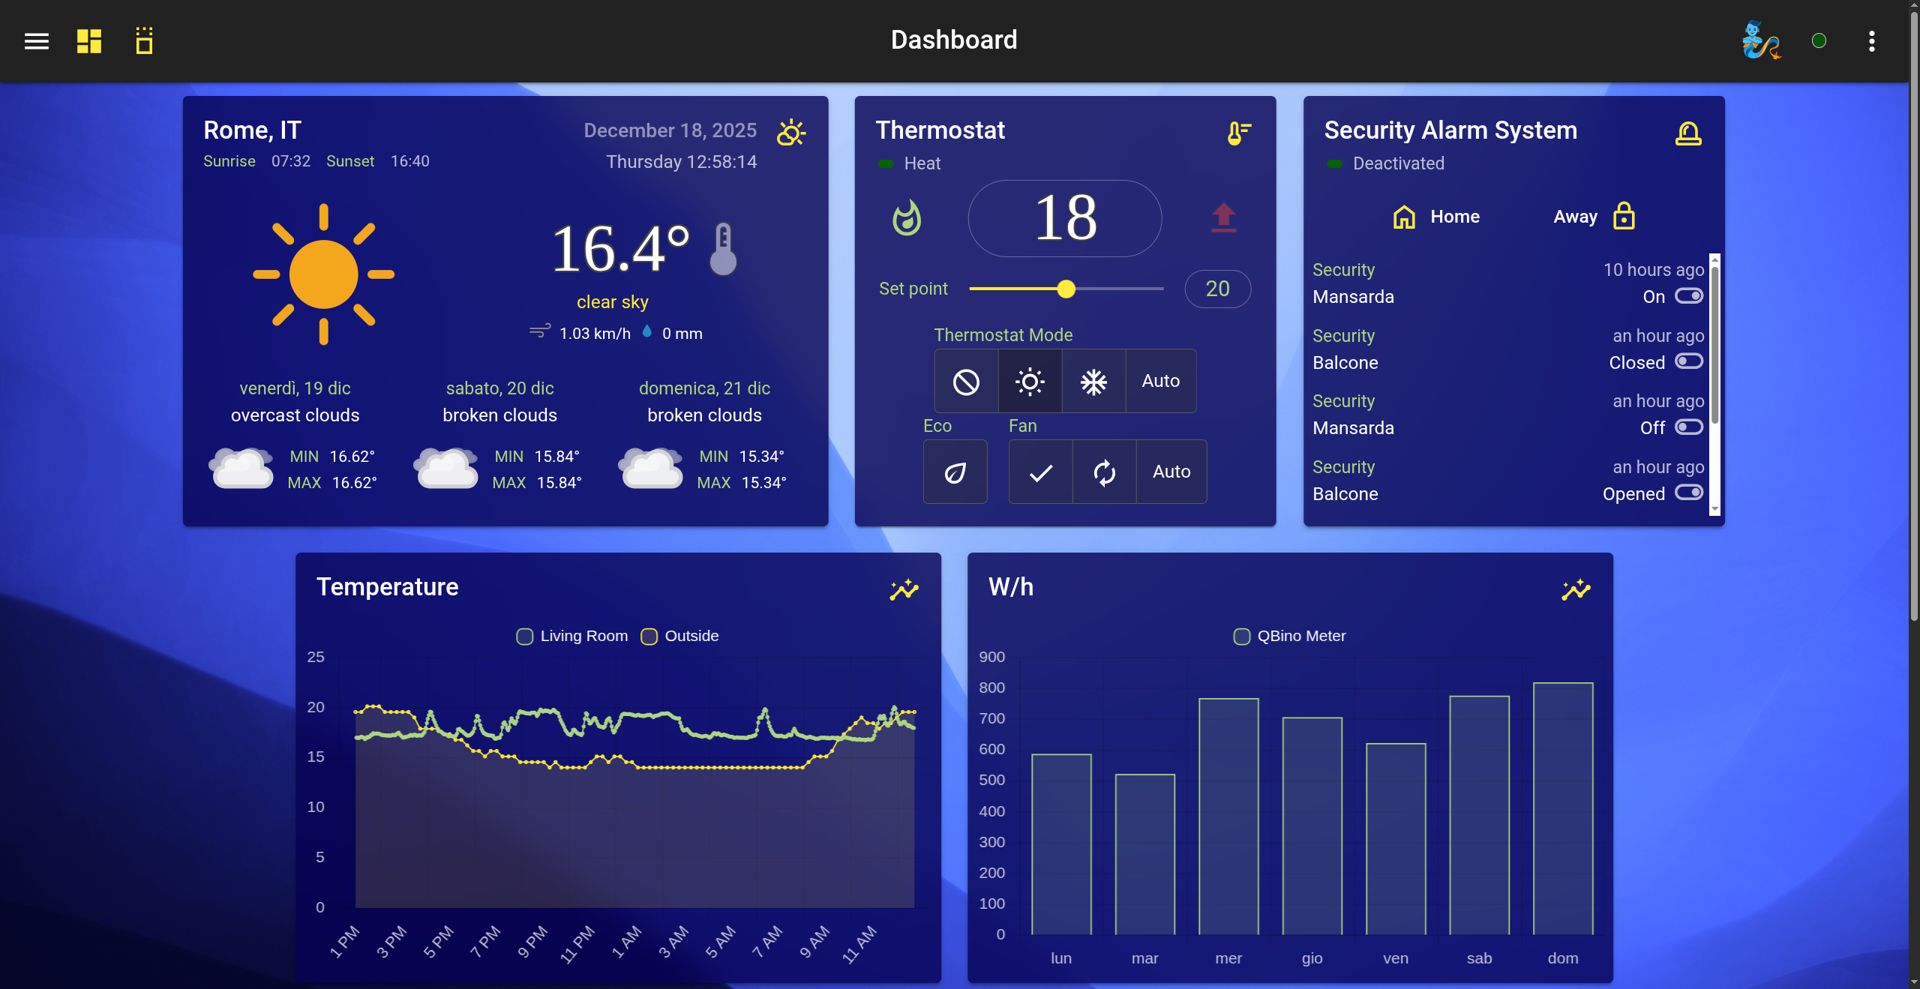
Real-time charts and energy statistics on the dashboard.

Open media
While automation programs and AI agents drive the action, it is Data Monitoring that gives you true visibility into the hidden mechanics of your system. HomeGenie elevates your setup from a simple command executor to a comprehensive analytics platform, effortlessly bridging the gap between raw hardware signals and actionable intelligence.
To grasp how HomeGenie visualizes data, you need to look at its foundation.
In the HomeGenie ecosystem, everything is a module, but these modules are never silent. They act as highly reactive nodes within a broader network. Whenever a state changes (a thermostat adjusting, a solar panel peaking in production, or an AI agent completing a task), the module instantly broadcasts an event across HomeGenie's internal message bus.
This continuous, high-speed flow of events is the true backbone of the system.
Instead of letting this valuable data vanish immediately after execution, HomeGenie's monitoring architecture intercepts, categorizes, and organizes this stream. It turns thousands of daily state changes into a structured timeline, ready to be explored, charted, and analyzed.
This continuous stream of energy is handled by a dual-layer storage architecture, designed for both blazing speed and long-term retention:
Volatile Memory Buffer (RAM): By default, HomeGenie maintains a high-speed, circular buffer directly in the system memory. This buffer typically holds the last 24 hours of data for every module parameter. This allows for instant rendering of daily charts without ever touching the disk, ensuring ultra-fast performance and significantly reducing wear on SD cards (a crucial feature for Raspberry Pi users).
Persistent Storage (Database): For long-term historical data, the Event Logger program (if enabled) captures these events and securely writes them to a persistent local database (LiteDB). This allows you to navigate back through weeks, months, or even years of data.
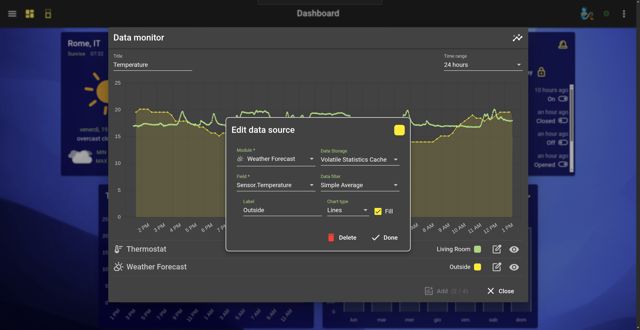
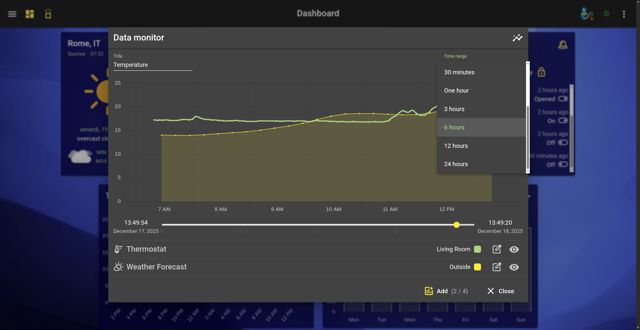
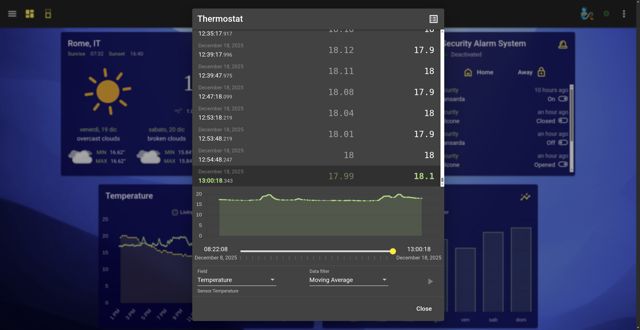
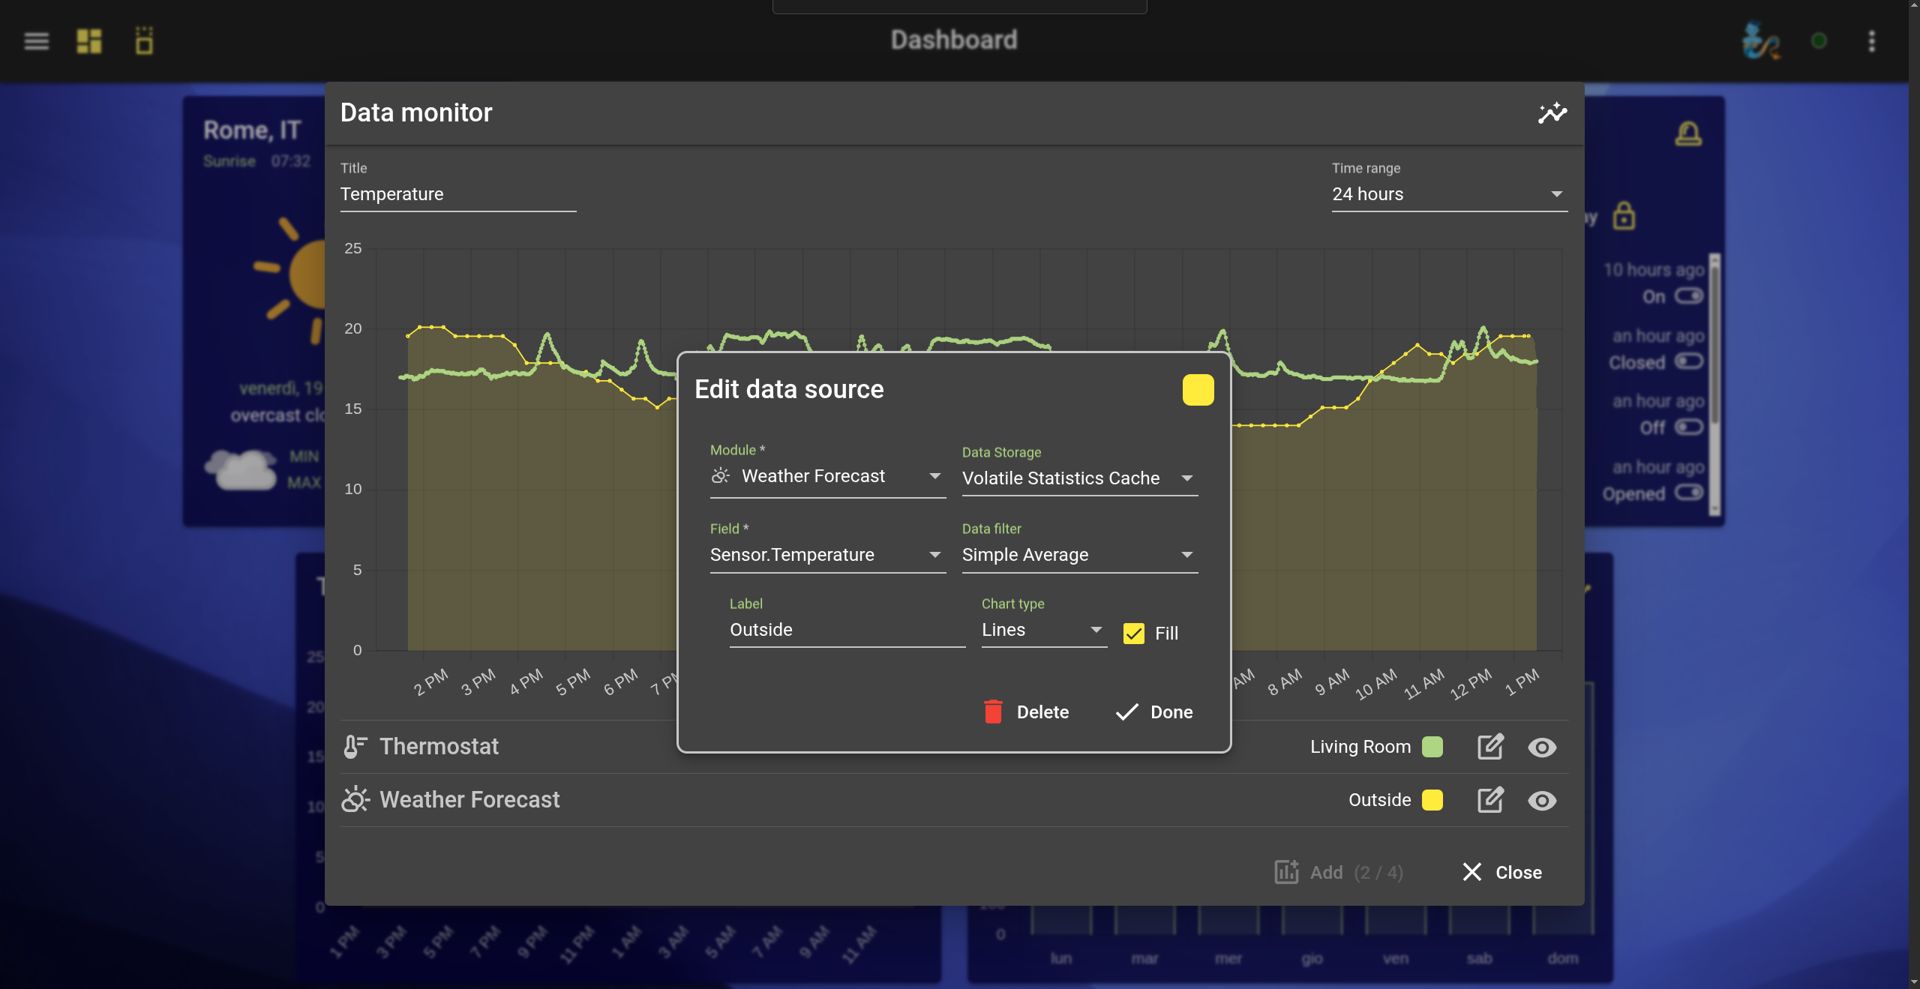
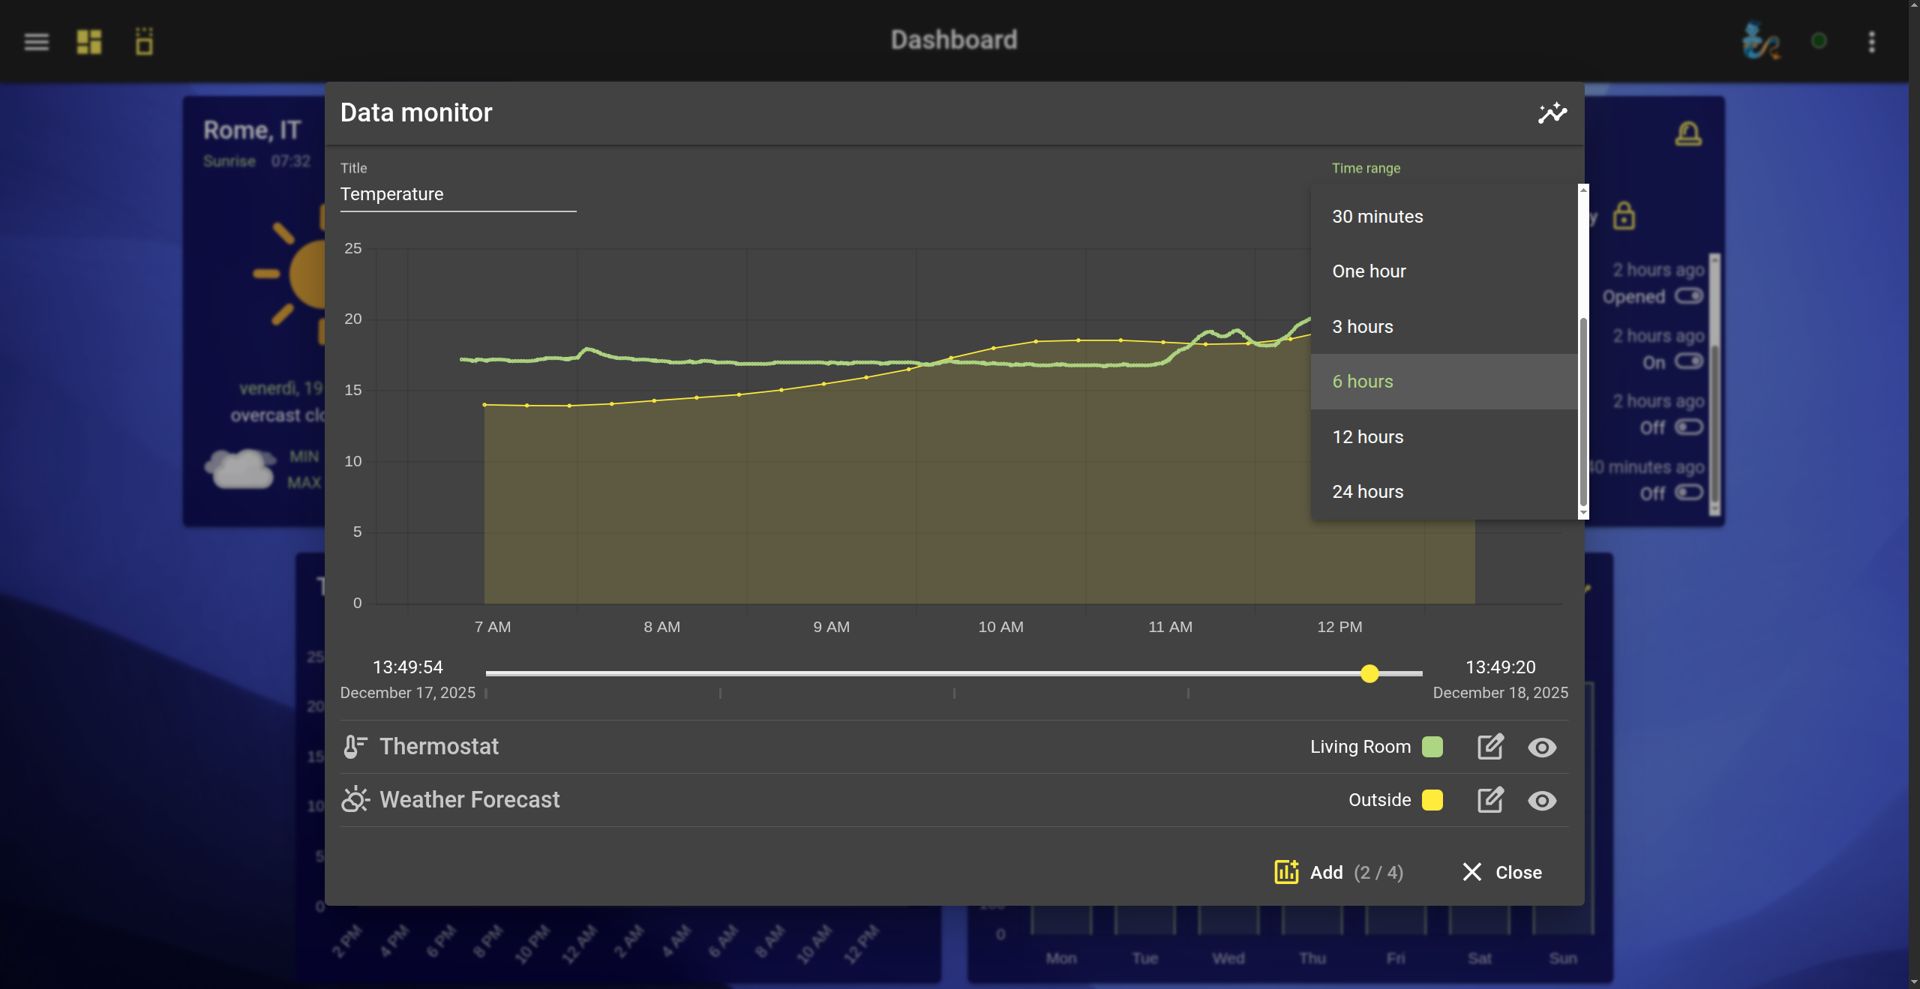
The Chart Widget is your window into this data stream. In version 2.0, it has been completely rewritten to handle massive datasets smoothly while providing highly intuitive navigation tools.
Forget static, lifeless graphs. You can now explore your data timeline dynamically:
When configuring a chart, the new "Data Storage" selector allows you to choose the exact origin of your data:
HomeGenie 2.0 introduces specialized logic for Energy Monitoring. Using a technique called Time-Boxing, the system aligns data samples to precise time intervals (e.g., exactly from 14:00:00 to 14:59:59). This guarantees that statistical calculations—like "Average Watts per Hour" or daily kilowatt accumulation—are mathematically rigorous and perfectly comparable.
New statistical chart types include:
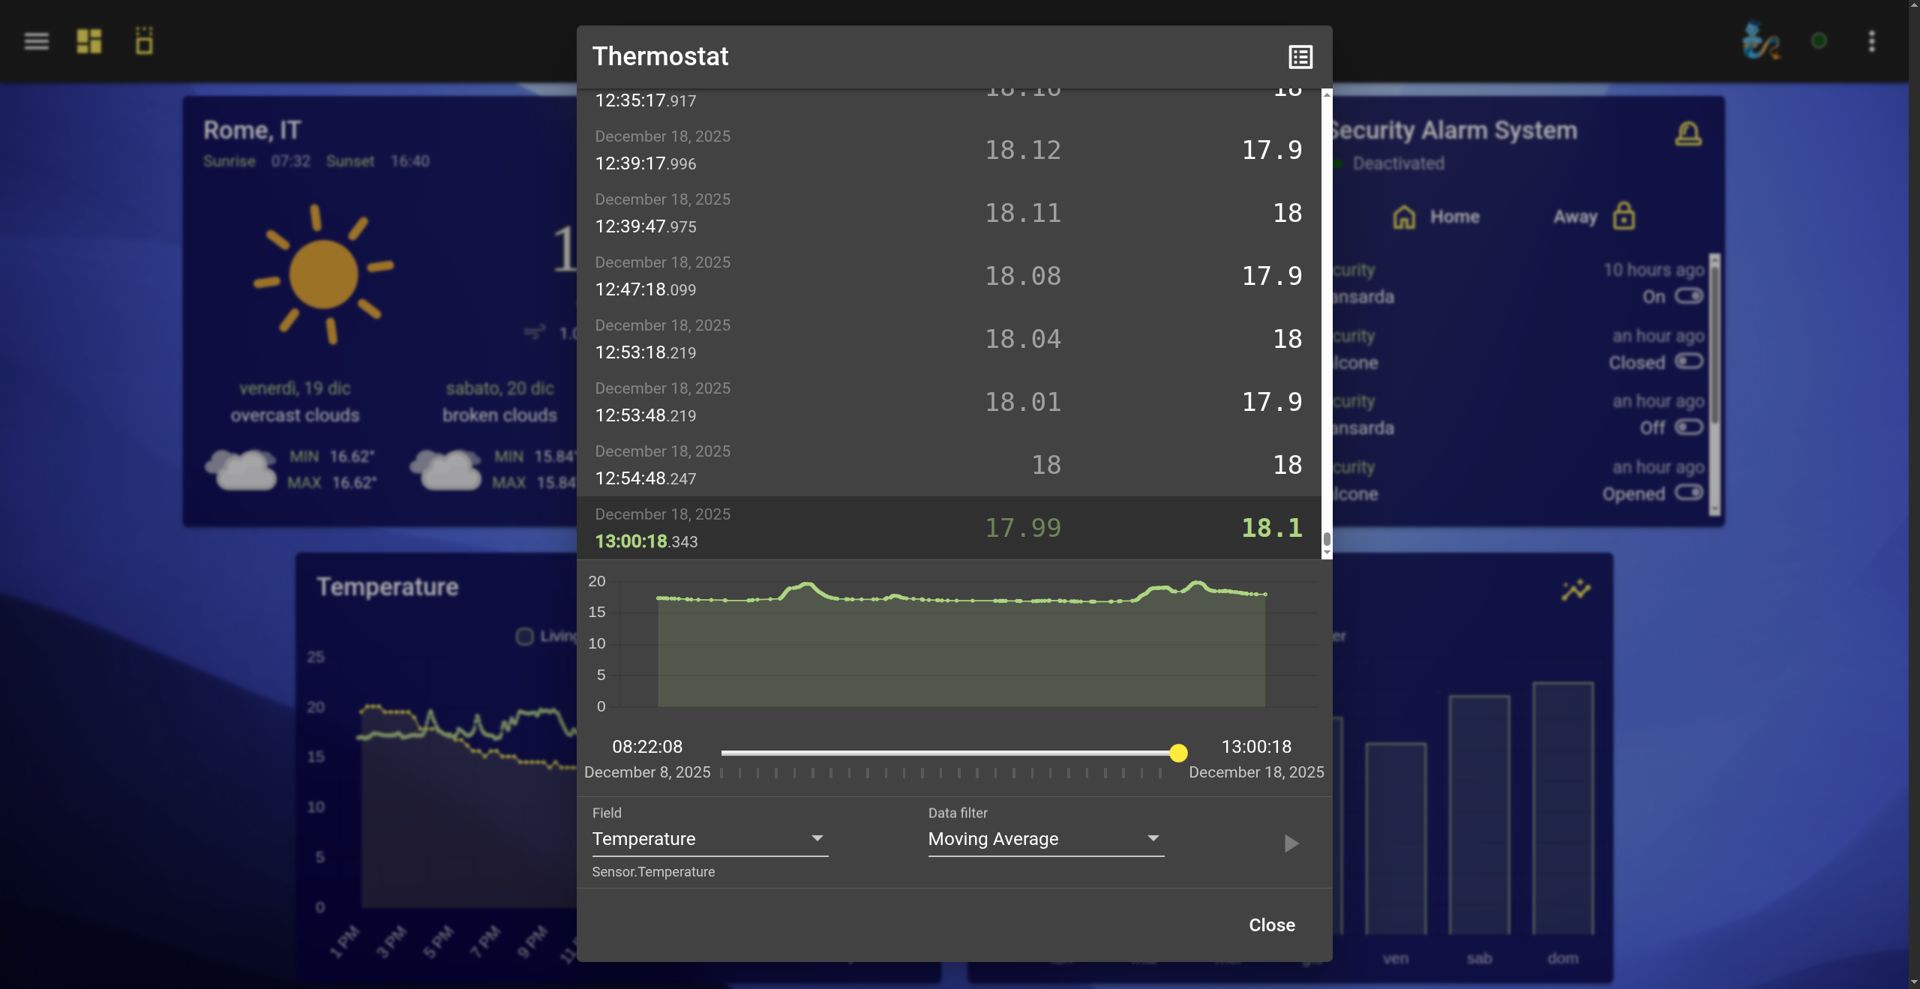
The Event Log page is not just a scrolling text list; it is a visual debugging environment. It allows you to literally see the heartbeat of your modules by combining the raw list of events with a graphical timeline preview.
Synchronized Navigation: Similar to the Chart widget, the Event Log features a graphical timeline at the top. By dragging or resizing the viewing window on this graph, the list of events below updates instantly to show only the logs generated during that specific micro-timeframe.
This makes troubleshooting incredibly fast: instead of scrolling through thousands of lines of text to figure out "when the light turned on," you simply spot the spike on the graph, zoom in, and instantly read the exact event sequence in the list below.
Plotting your data timeline is just the first step. For power users and data enthusiasts, HomeGenie embeds industry-standard analytical libraries directly into its C# scripting engine, turning your recorded events into a playground for advanced computation.
By leveraging the native integration of ML.NET and NWaves, you can push your automation logic far beyond simple "if-this-then-that" thresholds:
Sounds like a job for a Data Scientist? Not anymore.
You don't need a PhD in mathematics to harness this power. Thanks to our AI-driven architecture, advanced analytics are fully accessible to everyone through Vibe Coding.
If you want to explore predictive models or signal filtering, simply open the chat and ask Gemini Automan or the Widget Genie:
Analyze temperature data from the last 24 hours using ML.NET, and create a widget that predicts when the boiler should turn on tomorrow.
The AI will autonomously write the complex C# boilerplate, apply the algorithms, and deploy the predictive model for you. In HomeGenie, your data doesn't just sit on a disk—it learns, predicts, and evolves.